Water quality mapping has revolutionised how communities, researchers, and regulatory bodies monitor and assess the safety of drinking water supplies across vast geographical areas. These sophisticated digital tools combine real-time monitoring data with geographic information systems to provide comprehensive insights into water contamination patterns, treatment effectiveness, and public health risks. Modern water quality mapping platforms integrate multiple data sources, from automated sensor networks to laboratory analysis results, creating dynamic visualisations that help identify pollution hotspots and track improvements over time.
The complexity of water quality assessment extends far beyond simple pass-or-fail evaluations, requiring detailed understanding of chemical contaminants, microbiological indicators, and physical parameters that influence water safety. Effective interpretation of these mapping systems demands familiarity with regulatory standards, data collection methodologies, and the technical limitations inherent in various monitoring approaches. Whether you’re a public health official investigating contamination incidents or a concerned citizen checking local water quality, understanding how to navigate these platforms efficiently can provide invaluable insights into the safety and reliability of drinking water supplies in your area.
Understanding water quality parameters in digital mapping systems
Water quality mapping platforms typically display dozens of different parameters, each representing specific aspects of water safety and environmental health. These parameters fall into three primary categories: chemical contaminants, microbiological indicators, and physical characteristics. Understanding what each parameter represents and how it’s measured forms the foundation for effective map interpretation and decision-making.
Chemical contaminant indicators: nitrates, phosphates, and heavy metals
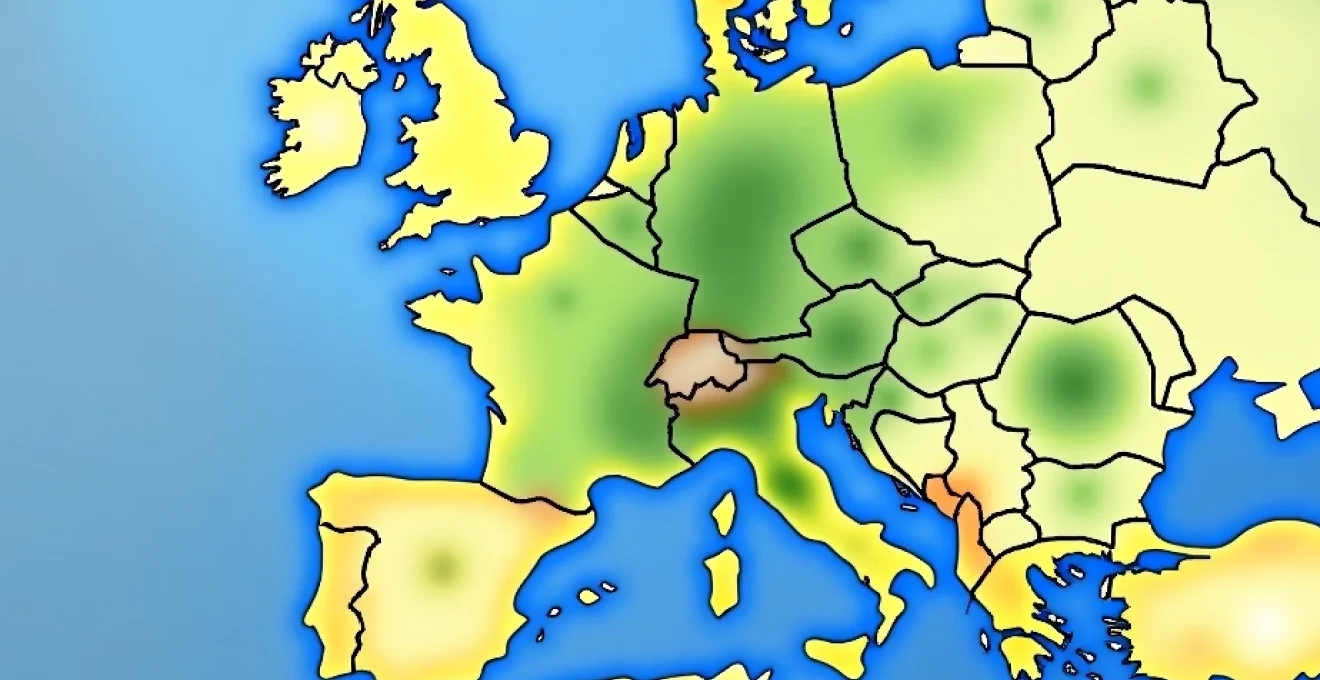
Chemical contamination represents one of the most significant threats to drinking water safety, with nitrates and heavy metals posing particular risks to human health. Nitrate concentrations above 10 mg/L can cause methemoglobinemia in infants, while phosphate levels indicate potential agricultural runoff that may signal broader contamination issues. Water quality maps typically use colour-coded systems to display these concentrations, with red zones indicating levels exceeding regulatory limits and green areas showing safe concentrations.
Heavy metals such as lead, mercury, and arsenic require specialised analytical techniques for accurate measurement, making their representation on quality maps particularly valuable for public health assessment. These contaminants often originate from industrial activities, aging infrastructure, or natural geological formations. Modern mapping platforms integrate data from multiple testing laboratories to provide comprehensive coverage, though the frequency of testing varies significantly between urban and rural areas.
Microbiological risk assessments: E. coli and coliform bacteria levels
Microbiological indicators serve as early warning systems for potential pathogen contamination, with E. coli and total coliform bacteria serving as primary surveillance targets. These organisms indicate recent sewage contamination and suggest the possible presence of disease-causing microorganisms including viruses, bacteria, and parasites. Coliform bacteria testing provides rapid results compared to direct pathogen detection, making it ideal for routine monitoring programmes displayed on quality mapping platforms.
Water quality maps typically display microbiological data using binary indicators or risk classifications rather than specific numerical values. This approach reflects the urgent public health implications of bacterial contamination, where any detection above acceptable limits triggers immediate investigation and potential water use advisories. The temporal aspect becomes crucial for microbiological parameters, as contamination events can occur rapidly and require immediate response.
Physical water quality metrics: turbidity, ph, and total dissolved solids
Physical parameters provide insights into water treatment effectiveness and potential contamination sources, with turbidity serving as a key indicator of filtration performance and sediment loading. Elevated turbidity levels can interfere with disinfection processes and indicate increased risk of microbiological contamination. pH measurements reveal water acidity or alkalinity, affecting both taste and the effectiveness of chemical treatment processes.
Total dissolved solids (TDS) measurements encompass all inorganic and organic substances dissolved in water, providing a general indicator of water quality and treatment needs. High TDS levels may indicate mineral contamination, salt intrusion in coastal areas, or inadequate treatment processes. Modern mapping platforms often correlate these physical parameters with chemical and microbiological data to provide comprehensive quality assessments.
Regulatory compliance standards: WHO guidelines and national water quality directives
International and national regulatory frameworks establish the benchmark values displayed on water quality mapping platforms, with World Health Organisation guidelines serving as the global standard for many parameters. These standards undergo regular revision based on emerging scientific evidence and improved analytical capabilities. National directives often impose stricter limits than WHO guidelines, reflecting local environmental conditions and public health priorities.
Understanding these regulatory frameworks helps interpret the significance of values displayed on quality maps. For instance, the EU Drinking Water Directive sets maximum allowable concentrations for numerous contaminants, with member states required to monitor compliance continuously. Water quality maps integrate these regulatory thresholds into their visual displays, using traffic light systems to indicate compliance status and highlight areas requiring immediate attention.
Regulatory compliance represents the minimum acceptable standard for water safety, not necessarily the optimal level for long-term health protection.
Navigating major water quality mapping platforms and databases
The landscape of water quality mapping includes numerous platforms ranging from government databases to commercial analytical tools, each offering unique features and data sources. Understanding the strengths and limitations of different platforms enables users to select appropriate tools for specific applications and cross-reference information for enhanced accuracy.
Environmental protection agency’s ECHO water quality database
The EPA’s Enforcement and Compliance History Online (ECHO) database provides comprehensive access to water quality data from regulated facilities across the United States, including drinking water systems, wastewater treatment plants, and industrial discharge points. This platform offers detailed compliance histories, inspection records, and enforcement actions, making it invaluable for regulatory oversight and public accountability. ECHO’s mapping interface allows users to search by geographic area, facility type, or specific violations, providing both current status and historical trends.
The database updates regularly with information from state environmental agencies, creating a near real-time picture of water quality compliance across different jurisdictions. Users can access detailed facility reports, including specific contaminant concentrations, testing frequencies, and corrective actions taken. The platform’s strength lies in its comprehensive regulatory focus, though it primarily covers point sources rather than ambient water quality conditions.
European environment agency’s water information system for europe (WISE)
WISE represents Europe’s most comprehensive water quality database, integrating data from all EU member states plus several neighbouring countries. The platform provides access to both drinking water quality and environmental water body assessments, supporting implementation of the Water Framework Directive and other European legislation. The mapping interface offers multiple layers including chemical status, ecological quality, and pollution pressure indicators.
The system’s particular strength lies in its standardised methodology across participating countries, enabling meaningful comparisons and trend analysis at continental scale. WISE incorporates data from thousands of monitoring stations, providing detailed coverage of both surface and groundwater quality. The platform also includes predictive modelling capabilities, helping users understand future water quality scenarios under different environmental and policy conditions.
Openstreetmap water quality layer integration and community data
Community-driven mapping platforms like OpenStreetMap increasingly incorporate water quality data through crowdsourced contributions and integration with official monitoring programmes. These platforms offer unique advantages in remote or underserved areas where official monitoring may be limited. Citizen science initiatives contribute valuable data through portable testing kits and smartphone applications, creating dense monitoring networks in some regions.
The collaborative nature of these platforms enables rapid response to emerging contamination events and provides local knowledge that complements official monitoring programmes. However, data quality and standardisation remain challenges, requiring careful verification against official sources. Integration with established monitoring networks helps validate community-contributed data while expanding geographic coverage.
Commercial platforms: AquaKnow, WaterTracker, and HydroShare analytics
Commercial water quality platforms offer advanced analytical capabilities and user-friendly interfaces designed for specific industry applications. These platforms often integrate multiple data sources, providing comprehensive assessments for water utilities, agricultural operations, and industrial facilities. Advanced features typically include predictive analytics, automated alerting systems, and customised reporting tools.
The commercial sector drives innovation in data visualisation and analysis techniques, often introducing features that later appear in government platforms. These systems frequently offer superior user experience and technical support, though access may be limited by licensing costs. Integration capabilities with existing monitoring equipment and laboratory information systems make commercial platforms attractive for large-scale operations.
Geographic information system (GIS) data interpretation techniques
Effective interpretation of water quality mapping data requires understanding the underlying GIS technologies and analytical methods used to process and display information. These technical considerations significantly influence how data should be interpreted and what conclusions can be drawn from visual representations.
Colour-coded contamination zones and risk classification systems
Modern water quality maps employ sophisticated colour schemes to communicate complex information quickly and intuitively. These visualisation systems typically use traffic light colours (red, amber, green) to indicate risk levels, with additional colour gradations providing finer detail about contamination severity. Understanding these colour schemes requires familiarity with the underlying data classification methods, which may use equal intervals, quantiles, or natural breaks to define category boundaries.
Risk classification systems integrate multiple parameters to provide overall assessments of water quality conditions. These composite indicators consider both the concentration of individual contaminants and their combined health implications. Advanced platforms may weight different parameters based on health significance, local environmental conditions, or regulatory priorities. Users must understand these weighting schemes to interpret composite risk scores accurately.
Temporal data analysis: seasonal variations and Long-Term trend identification
Water quality exhibits significant temporal variation due to seasonal changes, precipitation patterns, and human activities. Effective map interpretation requires understanding these temporal dynamics and how they influence data representation. Many platforms offer time-series analysis tools that reveal seasonal patterns, helping users distinguish between normal variation and genuine contamination events.
Long-term trend analysis capabilities enable identification of gradual changes in water quality that might not be apparent from snapshot data. These trends may reflect climate change impacts, land use changes, or the effectiveness of pollution control measures. Statistical trend analysis techniques help separate genuine trends from natural variability, providing insights into the success of environmental management strategies.
Spatial interpolation methods: kriging and inverse distance weighting applications
Water quality mapping platforms use spatial interpolation techniques to estimate values at unmonitored locations based on nearby measurements. Kriging and inverse distance weighting represent the most common approaches, each with specific advantages and limitations. Kriging methods consider spatial correlation patterns in the data, providing statistically optimal predictions and uncertainty estimates for interpolated values.
Understanding interpolation methods helps users assess the reliability of quality estimates in areas between monitoring points. These techniques work best when monitoring stations are evenly distributed and environmental conditions are relatively uniform. In areas with sparse monitoring or complex environmental gradients, interpolated values should be interpreted cautiously, particularly when making decisions with significant health or economic implications.
Cross-referencing multiple data sources: satellite imagery and Ground-Truth validation
Advanced water quality assessment increasingly integrates satellite imagery with ground-based monitoring to provide comprehensive coverage and validation of results. Satellite data can identify pollution plumes, algal blooms, and sediment transport patterns that complement point-source monitoring. Cross-referencing these data sources helps identify discrepancies and validate interpolated estimates in remote areas.
Ground-truth validation remains essential for calibrating remote sensing data and ensuring accuracy of quality assessments. The combination of multiple data sources provides robust quality assurance and helps identify systematic errors in individual monitoring systems. This multi-source approach becomes particularly valuable during emergency response situations where rapid assessment of large areas is required.
The integration of multiple data sources provides a more complete picture of water quality conditions than any single monitoring approach can achieve alone.
Practical applications for water quality map analysis
Water quality mapping serves diverse applications across public health, environmental management, and regulatory compliance sectors. Understanding these practical applications helps users select appropriate tools and interpretation methods for specific needs. Public health officials rely on these platforms for rapid contamination assessment and outbreak investigation, while environmental managers use them for pollution source identification and remediation planning.
Emergency response applications demand real-time data access and rapid assessment capabilities. During contamination incidents, quality maps help define affected areas, guide sampling strategies, and support public advisory decisions. The ability to overlay population density data with contamination zones enables targeted public health interventions and resource allocation. Historical data analysis supports forensic investigation of contamination sources and helps establish liability for environmental damage.
Agricultural applications focus on irrigation water quality and nutrient management planning. Farmers use quality maps to identify suitable water sources and avoid areas with elevated salt concentrations or toxic contaminants. Precision agriculture techniques increasingly integrate water quality data with soil conditions and crop requirements to optimise irrigation strategies and minimise environmental impacts.
Urban planning applications incorporate water quality considerations into development decisions and infrastructure investments. Quality maps help identify areas requiring enhanced water treatment capabilities or alternative supply sources. Climate change adaptation planning uses historical quality trends and predictive modelling to anticipate future water security challenges and guide long-term investment strategies.
Technical limitations and data accuracy considerations
Understanding the limitations of water quality mapping platforms is crucial for appropriate interpretation and decision-making. Data accuracy depends on numerous factors including sampling methods, analytical techniques, and temporal resolution of measurements. Monitoring frequency varies significantly between different water systems and geographic areas, creating gaps in temporal coverage that may miss short-term contamination events.
Laboratory analytical capabilities influence the range of contaminants that can be detected and reported on quality maps. Advanced analytical methods can detect trace concentrations of emerging contaminants, while standard monitoring may miss these substances entirely. The detection limits of different analytical methods affect how quality maps display low-level contamination, with values below detection limits often excluded from spatial analysis.
Spatial resolution limitations affect the accuracy of quality estimates between monitoring points, particularly in areas with complex environmental gradients or point-source contamination. Interpolation methods assume gradual changes in water quality, which may not reflect reality near contamination sources or natural boundaries. Users should exercise caution when interpreting quality estimates in areas distant from actual monitoring locations.
Data quality assurance protocols vary between monitoring programmes and may not be clearly documented on mapping platforms. Understanding these quality control measures helps assess the reliability of displayed information and guides appropriate use of the data. Chain-of-custody procedures, analytical certification requirements, and data validation protocols all influence the accuracy of information presented on quality maps.
Technical limitations should be clearly communicated to users to prevent misinterpretation of water quality data and inappropriate decision-making based on incomplete information.
Advanced filter configuration and custom query development
Modern water quality mapping platforms offer sophisticated filtering and query capabilities that enable users to extract specific information from large datasets. These advanced features allow customised analysis of contamination patterns, regulatory compliance trends, and environmental conditions. Parameter-specific filtering enables users to focus on contaminants of particular concern, such as heavy metals in industrial areas or agricultural chemicals in farming regions.
Custom query development requires understanding database structure and query syntax used by different platforms. Advanced users can create complex queries combining multiple parameters, temporal ranges, and geographic boundaries to address specific research or management questions. Boolean operators and conditional statements enable sophisticated data mining that reveals hidden patterns and relationships within water quality datasets.
Automated alerting systems represent advanced applications of filtering technology, monitoring real-time data streams for specified conditions and triggering notifications when thresholds are exceeded. These systems support proactive water quality management and enable rapid response to emerging contamination events. Configuration of alert parameters requires careful consideration of false positive rates and the urgency of different contamination scenarios.
Export capabilities enable integration of mapping platform data with external analytical tools and reporting systems. Common export formats include CSV files for statistical analysis, GIS shapefiles for spatial analysis, and API connections for real-time data integration. Understanding these export options maximises the value of mapping platforms by enabling sophisticated analysis using specialised tools and custom applications tailored to specific organisational needs and analytical requirements.